I led and worked with a team of fellow students at the Australian National University (ANU) to develop an artistic data visualisation web app. It was made for a year-long project at the ANU, where students worked with real world clients to deliver a product. I had the role of Project Manager during this time.
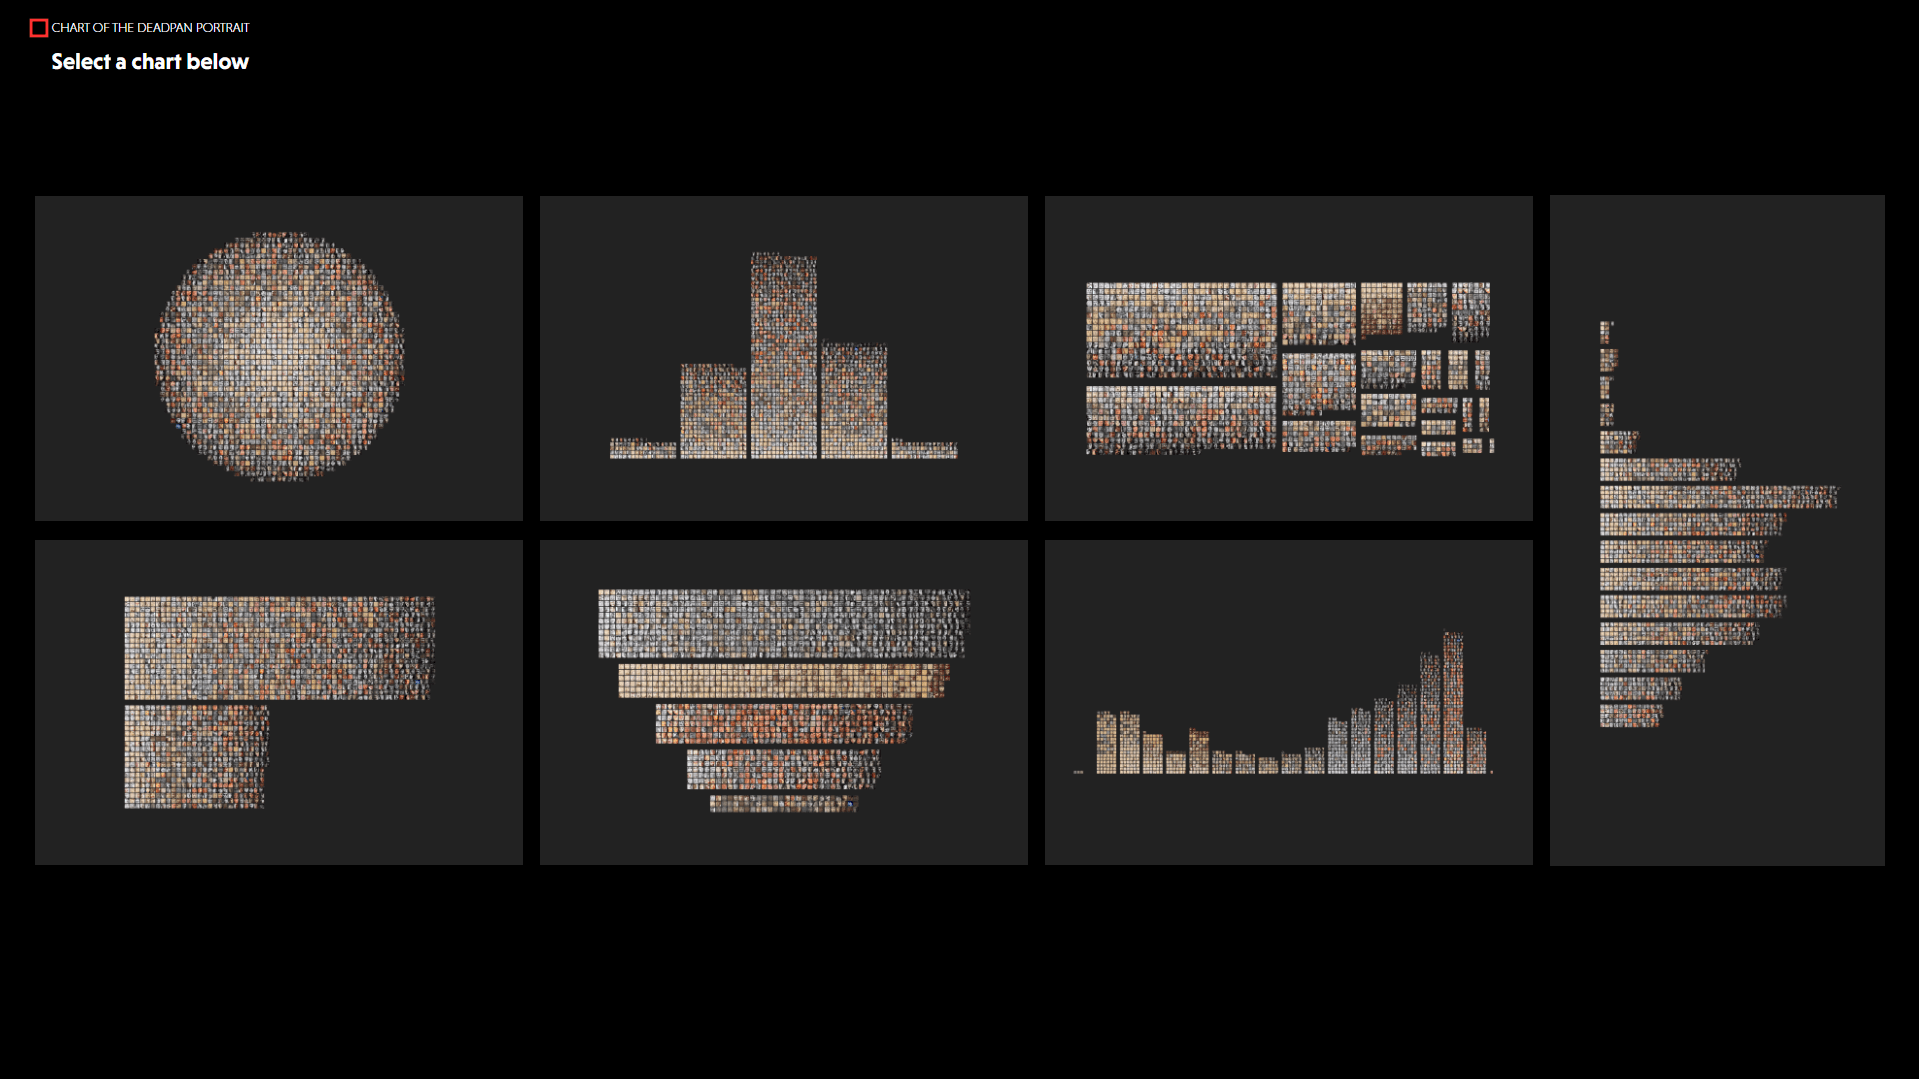
The App The web app visualises metadata from a portrait dataset, such as charts showing the age of the subjects. Visually, the charts are comprised of portraits that make up their respective category. For example, there's a bar chart that shows the age distribution of the dataset. The 15 - 30 year old bar is visually made of all the portraits of subjects within that age range. The app is also interactive with zooming, panning, animations, and intuitive navigation for use in public art exhibitions.
Tech Stack The app was developed in TypeScript using the Svelte front-end framework, and the visuals were made mainly using the PixiJS library. A development server with CI/CD was hosted using GitLab and an AWS EC2 instance.
Image credit to our beloved client, Melita Dahl.


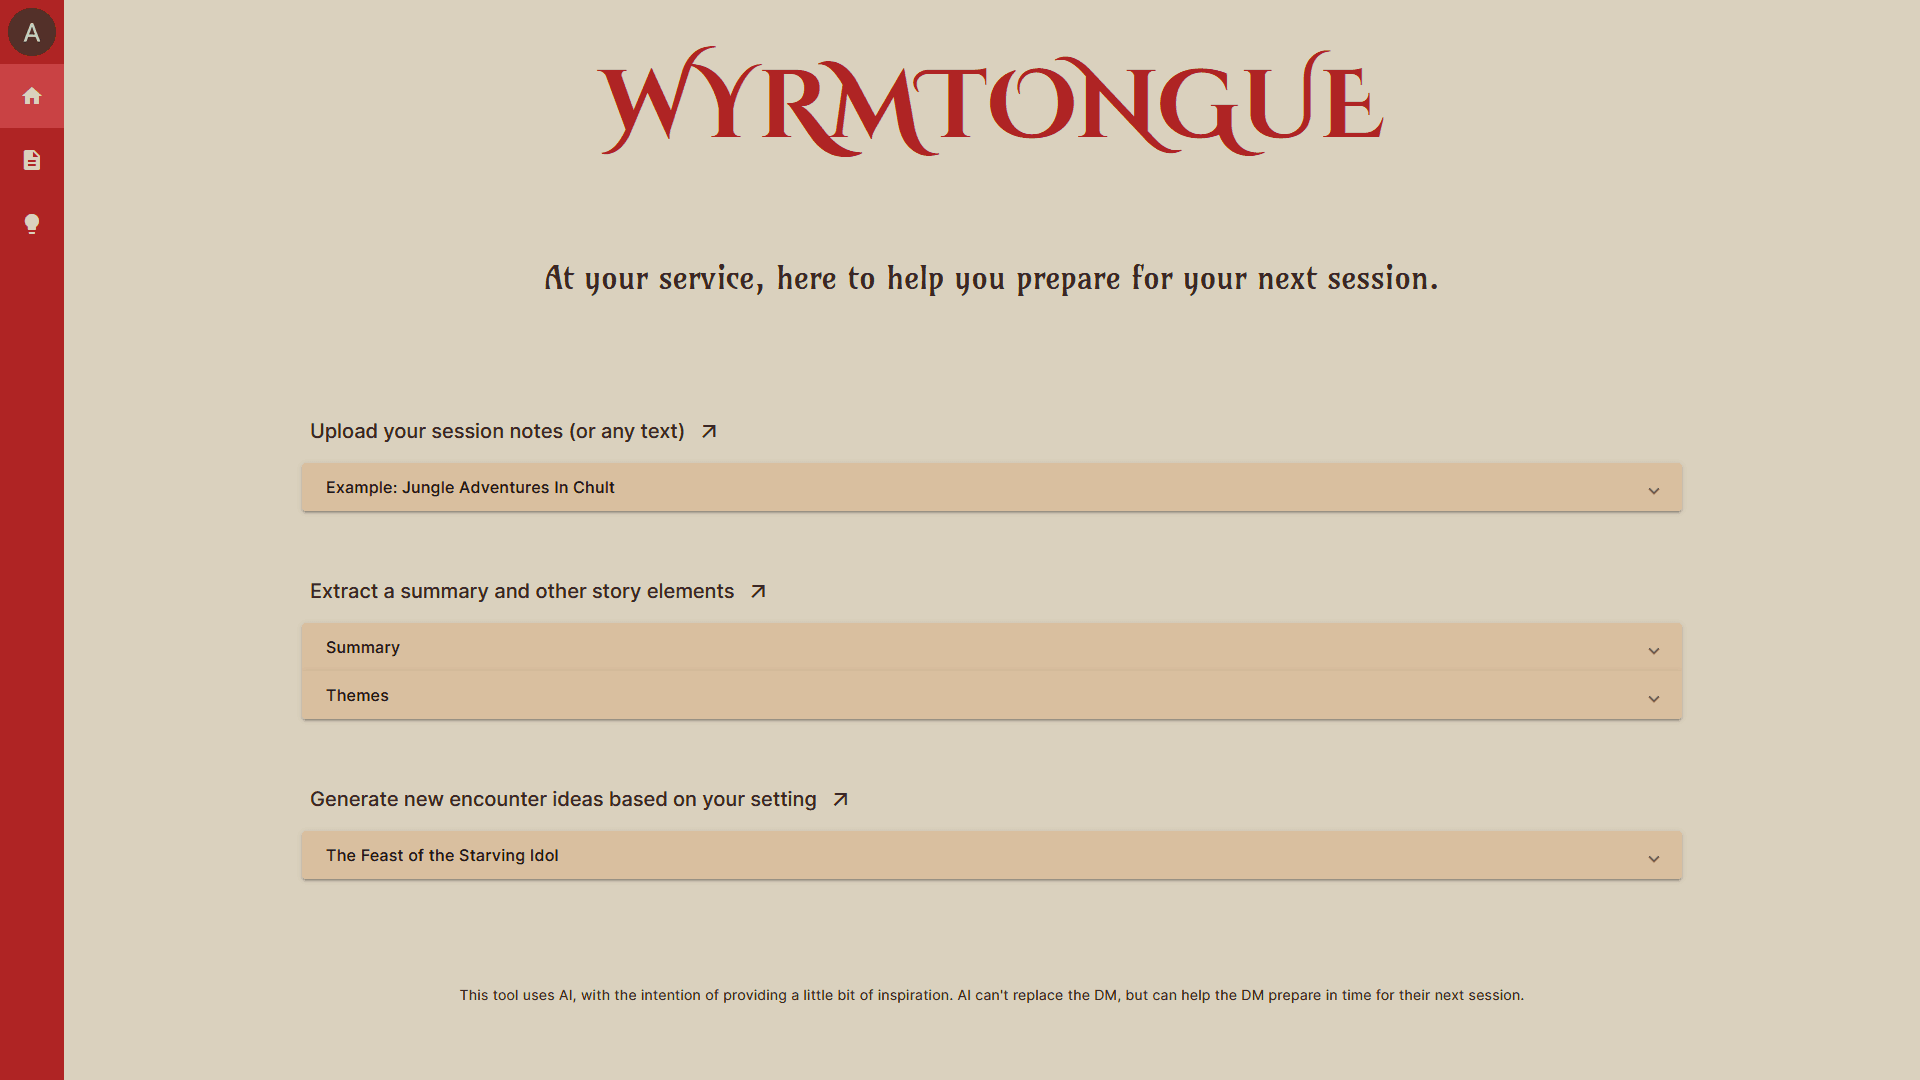
Wyrmtongue is a personal project I worked on initially just to learn how to integrate LLMs with web applications. Now, it's publicly available and currently in a serviceable state. Its primary function is to generate storytelling ideas for Tabletop Role-Playing Games.
The App Users can upload their text documents containing any writing and information related to their game's setting. The app uses these documents to generate new and unique ideas to give inspiration for the user's game, all of which tries to fit within the user's setting.
Tech Stack It was developed in TypeScript using Angular for the front-end, Express and MongoDB for the back-end, and Firebase for authentication. It's currently hosted on an AWS EC2 instance, with CI/CD using GitHub actions. The source code with instructions on self-hosting is available here.


During my research internship at CSIRO, I worked closely with supervision of ML researchers to investigate and improve an (at the time) new setting of Object Detection proposed by Li et al. (2022). By the end my improvements were at best incremental, but the experience of scientific research and communication is something I highly value.
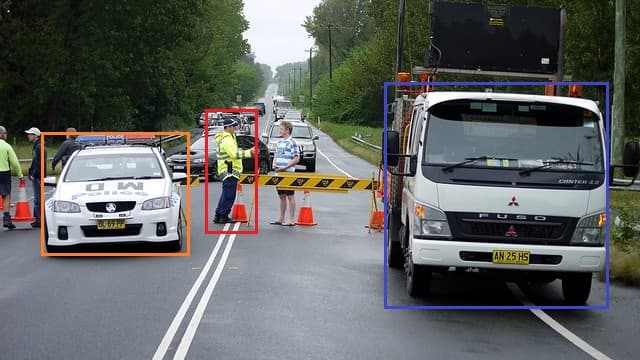
The Project As illustrated above, the setting only has 1 instance of each type annotated. For example, only 1 human is annotated, although there are many humans in the image. I attempted to find improvements in the original method proposed by Li et al. (2022). I applied concepts proposed in other settings, such as Negative Learning and Memory Banks.
Tech Stack Expanding upon the source code available in the aforementioned paper, I coded in Python using the PyTorch library.
Image adapted from the COCO 2017 dataset.


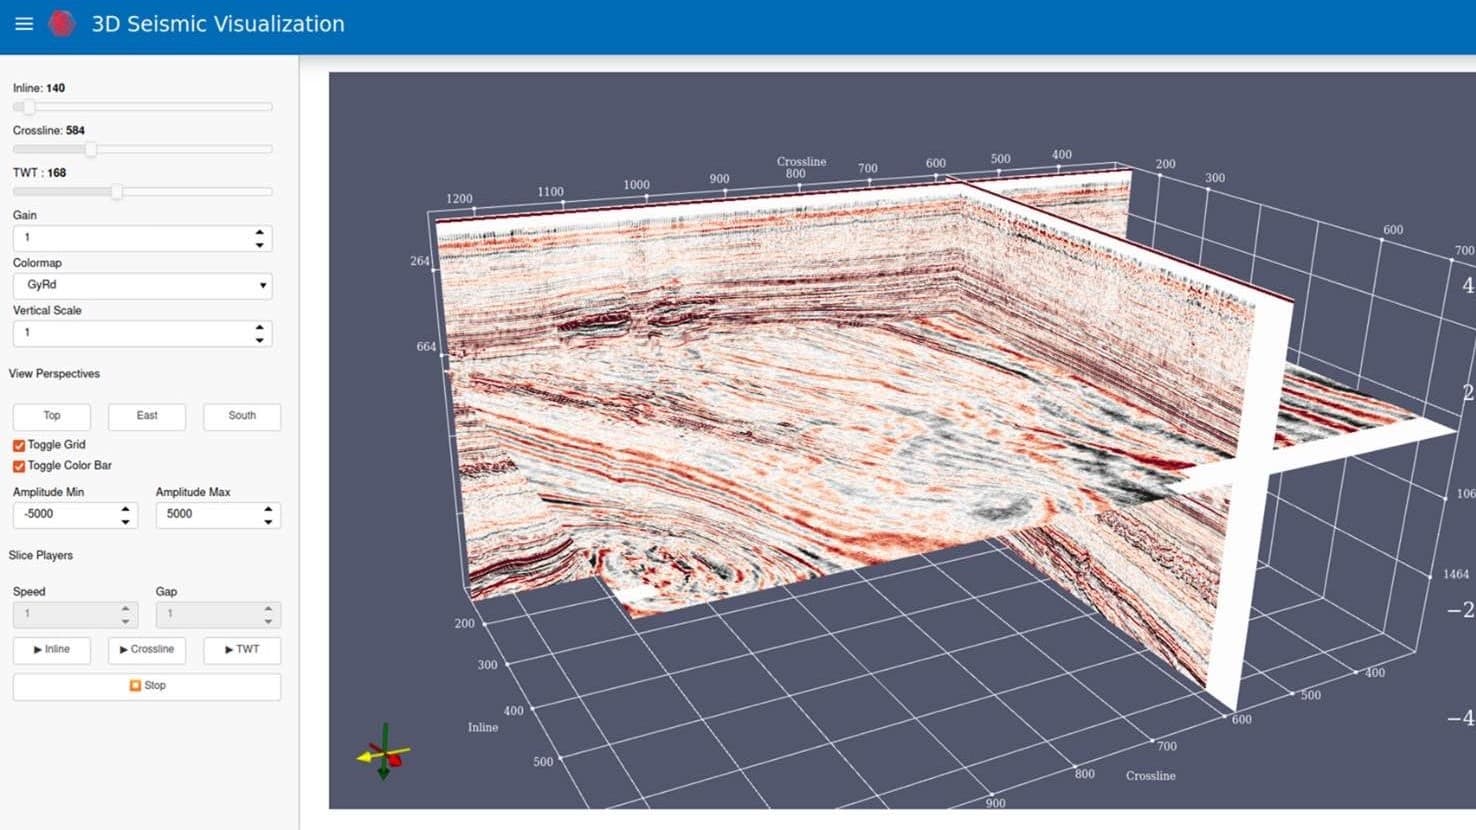
As part of an internship, I developed a 3D data visualiser of seismic data for and under the guidance of a geoscience expert. It was one of my first projects done from scratch to completion.
The App Loading seismic data (which I understand very little of) stored as numpy arrays, the app visualises it according to user-set parameters. The user can zoom and move around the 3D environment to get a better view of data. The user can also select certain slices of data to view, and adjust the gain or colormap of the visualiser according to their needs.
Tech Stack The front-end of the tool was built in Python using the panel library. The visualiser was written in JavaScript using the vtk.js library.

